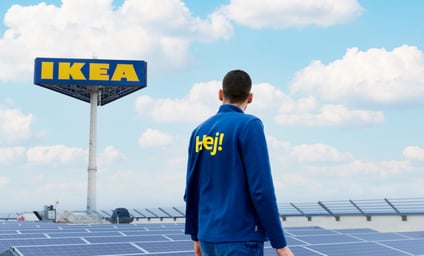
A girl walks with an IKEA bag of plants in her hand where the picture is taken in profile against a yellow wall.

Ingka Group Annual Summary FY22

Better planet  

We are taking bold steps to contribute to the IKEA commitment to become a climate positive and circular business by 2030. By, for example, reducing our energy consumption, switching to renewable energy and using zero emission deliveries, we’re exploring ways to play our part in creating a circular economy and reducing our climate footprint.

Download report chapter: Better planet
A graphic symbol in a circle symbolizing Better planet.

Working for a better planet

During financial year 2022 (FY22), we continued to work towards the IKEA goal of becoming climate positive and circular by 2030, increasing the share of renewable energy used in our operations and exceeding our production food waste reduction target. We take pride in our progress, but to increase transparency, we highlight our challenges as well.

A sunny day with blue sky in a field with wind turbines.

What we are proud of

Ingka Group has an important part to play in tackling our impact on the climate and creating a circular economy. Step by step, we are working towards our goal of creating a better planet. Learn more about some of our highlights from the past financial year.  

  • In FY22, 74.2% of the electricity we used was from renewable sources. This enabled us to reduce our operational climate footprint (scope 1 and 2 emissions) by 32.3% from our FY16 baseline.
  • We achieved our goal to cut food waste by 50% by December 31, 2021. The reduction in food waste from FY17 is equivalent to the food used in 20 million meals, and 36,000 tonnes of CO2e emissions avoided.  
Two IKEA employees talk to each other inside a kitchen.

Challenges we are addressing

We have reduced our total climate footprint across our value chain (scope 1, 2 and 3 emissions) by 13.6% from FY16. However, we need to significantly accelerate our progress in order to become climate positive by 2030.   

We reduced operational waste by 9.5% compared to FY21 and our recycling rate has remained stable at 75.7% (FY21: 75.0%). It has been challenging to increase recycling rates, particularly at our Ingka Centres meeting places, where a large proportion of the waste is mixed consumer waste that tends to be contaminated, for example with food residue. 

Progress against targets

Our vision is to create a better everyday life for the many people. We are setting targets and evaluating our performance for how we can become better in four ways: better homes, better lives, better planet and better company. Below you will find our targets1 and performance as we work to create a better planet.

Climate footprint of our operations (scope 1 and 2)

1.
Reduce absolute greenhouse gas emissions from our own operations (scope 1 and 2) by 80% by 2030 (from FY16).2
On track

Performance against target

In FY22, our greenhouse gas emissions from our own operations (scope 1 and 2) decreased by 32.3% against our FY16 baseline6 and by 23.0% since FY21. This was mainly due to an increase in use of renewable electricity. Note: this is a science-based target (approved by the SBTi).

Climate footprint – our operations (Scope 1 and 2)

Thousand tonnes CO2e

  • Scope 1
  • Scope 2
  • Goal
Last updated 2023-02-15
2.
Use 100% renewable electricity in our operations by 2025. 
On track

Performance against target

In FY22, 74.2% of the electricity we used was from renewable sources3, compares to 69.1% in FY21.

Renewable electricity in our operations

(percentage of total energy use)

Last updated 2023-02-15
3.
Renewable heating and cooling systems in 100% of our buildings by 2030.4
Not on track

Performance against target

We installed renewable heating and cooling at all 11 new sites opened in FY22, where we own the building or have operational control of the heating and cooling contracts. We also replaced gas heating system with heat pumps in a handful of our existing units including in Evry in France and Adelaide and Rhodes in Australia. Our greenhouse gas emissions related to heating and cooling have decreased by 13.1% since FY21, but are still 3.6% above our FY16 baseline. In the coming years, we aim to improve our performance by implementing further energy efficiency measures and converting more of our buildings to renewable heating and cooling. 

A living room in the color green with furnishings from IKEA where you can also see a heat pump hung on the wall.
Last updated 2023-02-15

Climate footprint of co-worker and customer travel, and home deliveries (scope 3)

1.
All company owned, leased and shared vehicles used in our operations to be zero emission by 2025.
Not on track

Performance against target

We have purchased electric cars in 15 countries, but progress was limited by lack of availability of electric vehicles in the market. We have started to use fleet management services to track the number of zero emissions vehicles.  

Image of IKEA electric car where products are delivered to customers' homes.
Last updated 2023-02-15
2.
Reduce relative greenhouse gas emissions from customer and co-worker travel and home deliveries by 50% per person5 by 2030 (from FY16).
On track

Performance against target

We have achieved a 16.7% reduction in relative emissions from our FY16 baseline6 and a 10.7% reduction from FY21. This is mainly due to our expansion in city centres, which has made our stores and meeting places more accessible and reduced the average journey time for our customers and co-workers.   

Note: This is a science-based target (approved by the SBTi). 

Relative greenhouse gas emissions from home deliveries, customer travel and co-worker travel*

(percentage of FY16 baseline emissions)

*The emissions are calculated relative to the number of trips taken. We updated our methodology for calculating scope 3 emissions from transport and have updated data for previous years

Last updated 2023-02-15
3.
All home deliveries made by zero emissions vehicles by 2025.
Not on track

Performance against target

In FY22, the proportion of home deliveries by electric or zero emission vehicles increased to 12.3% (FY21: 11.0%). Our progress in FY22 has continued to be impacted by difficult market conditions, including a lack of availability of electric vehicles and delays in receiving orders placed for new vehicles. We have marked this target as ‘not on track’ due to the current status of progress. In FY23 we will work to speed up progress towards our 2025 target.

Picture of a woman sorting packages inside an IKEA electric car where products are delivered to customers' homes.
Last updated 2023-02-15

Climate footprint of IKEA products and food (scope 3)

1.
Contribute to a 15% reduction in the climate footprint of IKEA products and food by 2030, while still growing the IKEA business. Accounting for the estimated growth over the same period, this is equivalent to cutting the average climate footprint per product by an estimated 70%.
On track

Performance against target

Ingka Group contributed to this goal by promoting IKEA products, food and services with a lower climate footprint and by providing renewable electricity to IKEA suppliers. In FY22, scope 3 emissions from IKEA products and food arising from Ingka Group sales (89% of IKEA sales) decreased by 12.5% against the FY16 baseline. See IKEA Sustainability Report FY22 for further details of progress against the IKEA goal. 

Greenhouse gas emissions from products and food – scope 3*

(percentage of FY16 baseline emissions)

*The data covers scope 3 emissions arising from Ingka Group sales (89% of total IKEA sales), including supply chain emissions from the sourcing of raw materials, manufacturing, and transport of products as well as the use and disposal of IKEA products and food by our customers

Last updated 2023-02-15

Want to know more?

See the IKEA sustainability Report FY22 for more details of our progress against this target.

Striving for zero waste and becoming circular

1.
Reduce our operational waste and strive to recycle 100% of waste generated in our operations by 2030.
On track

Performance against target

In FY22, we recycled 75.7% of waste (FY21: 75.0%). Although our recycling rate remained stable over the year, our waste reduction initiatives have helped to reduce total waste by 9.5% in FY22 compared with FY21, and by 13.1% from FY177. 

Total waste produced by business unit1 (tonnes)

  • IKEA stores, shops & planning studios
  • Distribution centres
  • Ingka Centres
  • Offices2

1 We measure progress from FY17 since data for FY16 included estimates.
2 Data for offices was collected for the first time in FY21.

Last updated 2023-02-15
2.
Reduce production food waste by 50% by the end of 2021, compared with FY178.
Achieved

Performance against target

We reduced production food waste from our IKEA stores by 50% by 31 December 2021 (and by 57.8% by the end of FY22), compared with FY17. This target covers production food waste, which is the waste from our IKEA food service areas before the food is sold to our customers9. 

A person sorts food and throws it into a brown paper bag where you have food waste.

Curious to know more?

Download the full report to learn all the details.

Last updated 2023-02-15

1Data on scope 1 and 2 emissions and scope 3 transport emissions, which is used to track progress against relevant targets, is reviewed by our auditors as part of their assurance of our carbon data; see page 144 for the assurance statement and page 120 in the full report PDF for further details of data in scope of the assurance.

2This target covers our scope 1 and 2 greenhouse gas emissions which are responsible for 1.9% of our total climate footprint in FY22. This includes greenhouse gas emissions from energy use (1.7% of our total climate footprint) and other scope 1 and 2 activities relating to our operations, including refrigerants and company-owned vehicles. 

3This excludes the share of renewable electricity in Russia (which accounted for 8.4% of our total electricity in FY22) since we were unable to get evidence for the renewable electricity certificates. Our total electricity from renewable sources would have increased to 82.6% if this was included. See page 101 in the full report for more about changes to our operations in Russia.

4Our renewable heating and cooling target covers scope 1 fuels for heating and scope 2 district heating and district cooling. It excludes refrigerant gases used in cooling systems and fridges/freezers. Our separate target on renewable electricity covers scope 2 electricity used for heat pumps.

5Covers scope 3 emissions categories 6 (Business travel), 7 (Employee commuting) and 9 (Downstream transportation and distribution). 

6 We measure emissions per trip rather than per person. 

7 We measure progress from FY17 since data for FY16 included estimates.

8 This target deadline was extended to 31 December 2021 from our original goal of 31 August 2020. We have reported progress in our FY22 Report since the target deadline of 31 December 2021 falls within our FY22 financial year period (1 September 21 – 31 August 22). 

9Our performance also exceeds the Inter IKEA target to achieve a 50% reduction by the end of 2022, compared with FY17. The Inter IKEA target is a target for operational food waste for all franchisees (see further details of the Inter IKEA target in the IKEA Sustainability Report FY22)

Learn more about how we make life better